UX Research & Design
Footprint
In an innovation team, there is a lot of activity going on day to day. Innovation work can range from meetings with local customers to working on proof of concepts to creating demos for the Lab spaces. Current methods included a hodgepodge of various Excel documents and other project repositories. Therefore, there was a need to examine current practices and explore new ways to track projects.
Figma, Webex
Platform
Tools
Collaboration
Desktop
UI Engineer

Research Questions
Why is project tracking important?
What obstacles exist with current project tracking methods?
What information is important to retain?
How does information need to be displayed?
Who are the key users when it comes to project tracking?

Method
5 total participants
Three people leaders, a technical lead, and an operations lead
Participants
Test Design
30 minute moderated user interviews
Semi-structured format with open ended questions
Conducted through Webex meetings
Open coding
Affinity diagramming
Analysis & Synthesis

Results
The user interviews provided a variety of insights, including pain points, goals and impact, levels of visibility, importance of filtering, key analysis pivots, important data to retain, and additional learnings. To maintain confidentiality, I will not go into detail for each and every finding.
Mindsets
Mindsets allowed easy communication and presentation of key users in the project tracking space. Additional research synthesis was presented in the format of a Day in the Life/User Journey for each mindset.

How might we document the team’s footprint to support collaboration, facilitate reporting, and showcase impact?
Design Question
Design Requirements
Track Projects
Ability to log information about projects, including project timelines, key stakeholders, and overall impact.
View and Find Projects
Ability to see project activity across the labs and search for specific topics.
Visualize Projects
Ability to visually represent overall project activity.
Analyze Projects
Ability to pivot information based on various lenses and data points.
Wireframes & Site Map
Mockups

Next Steps
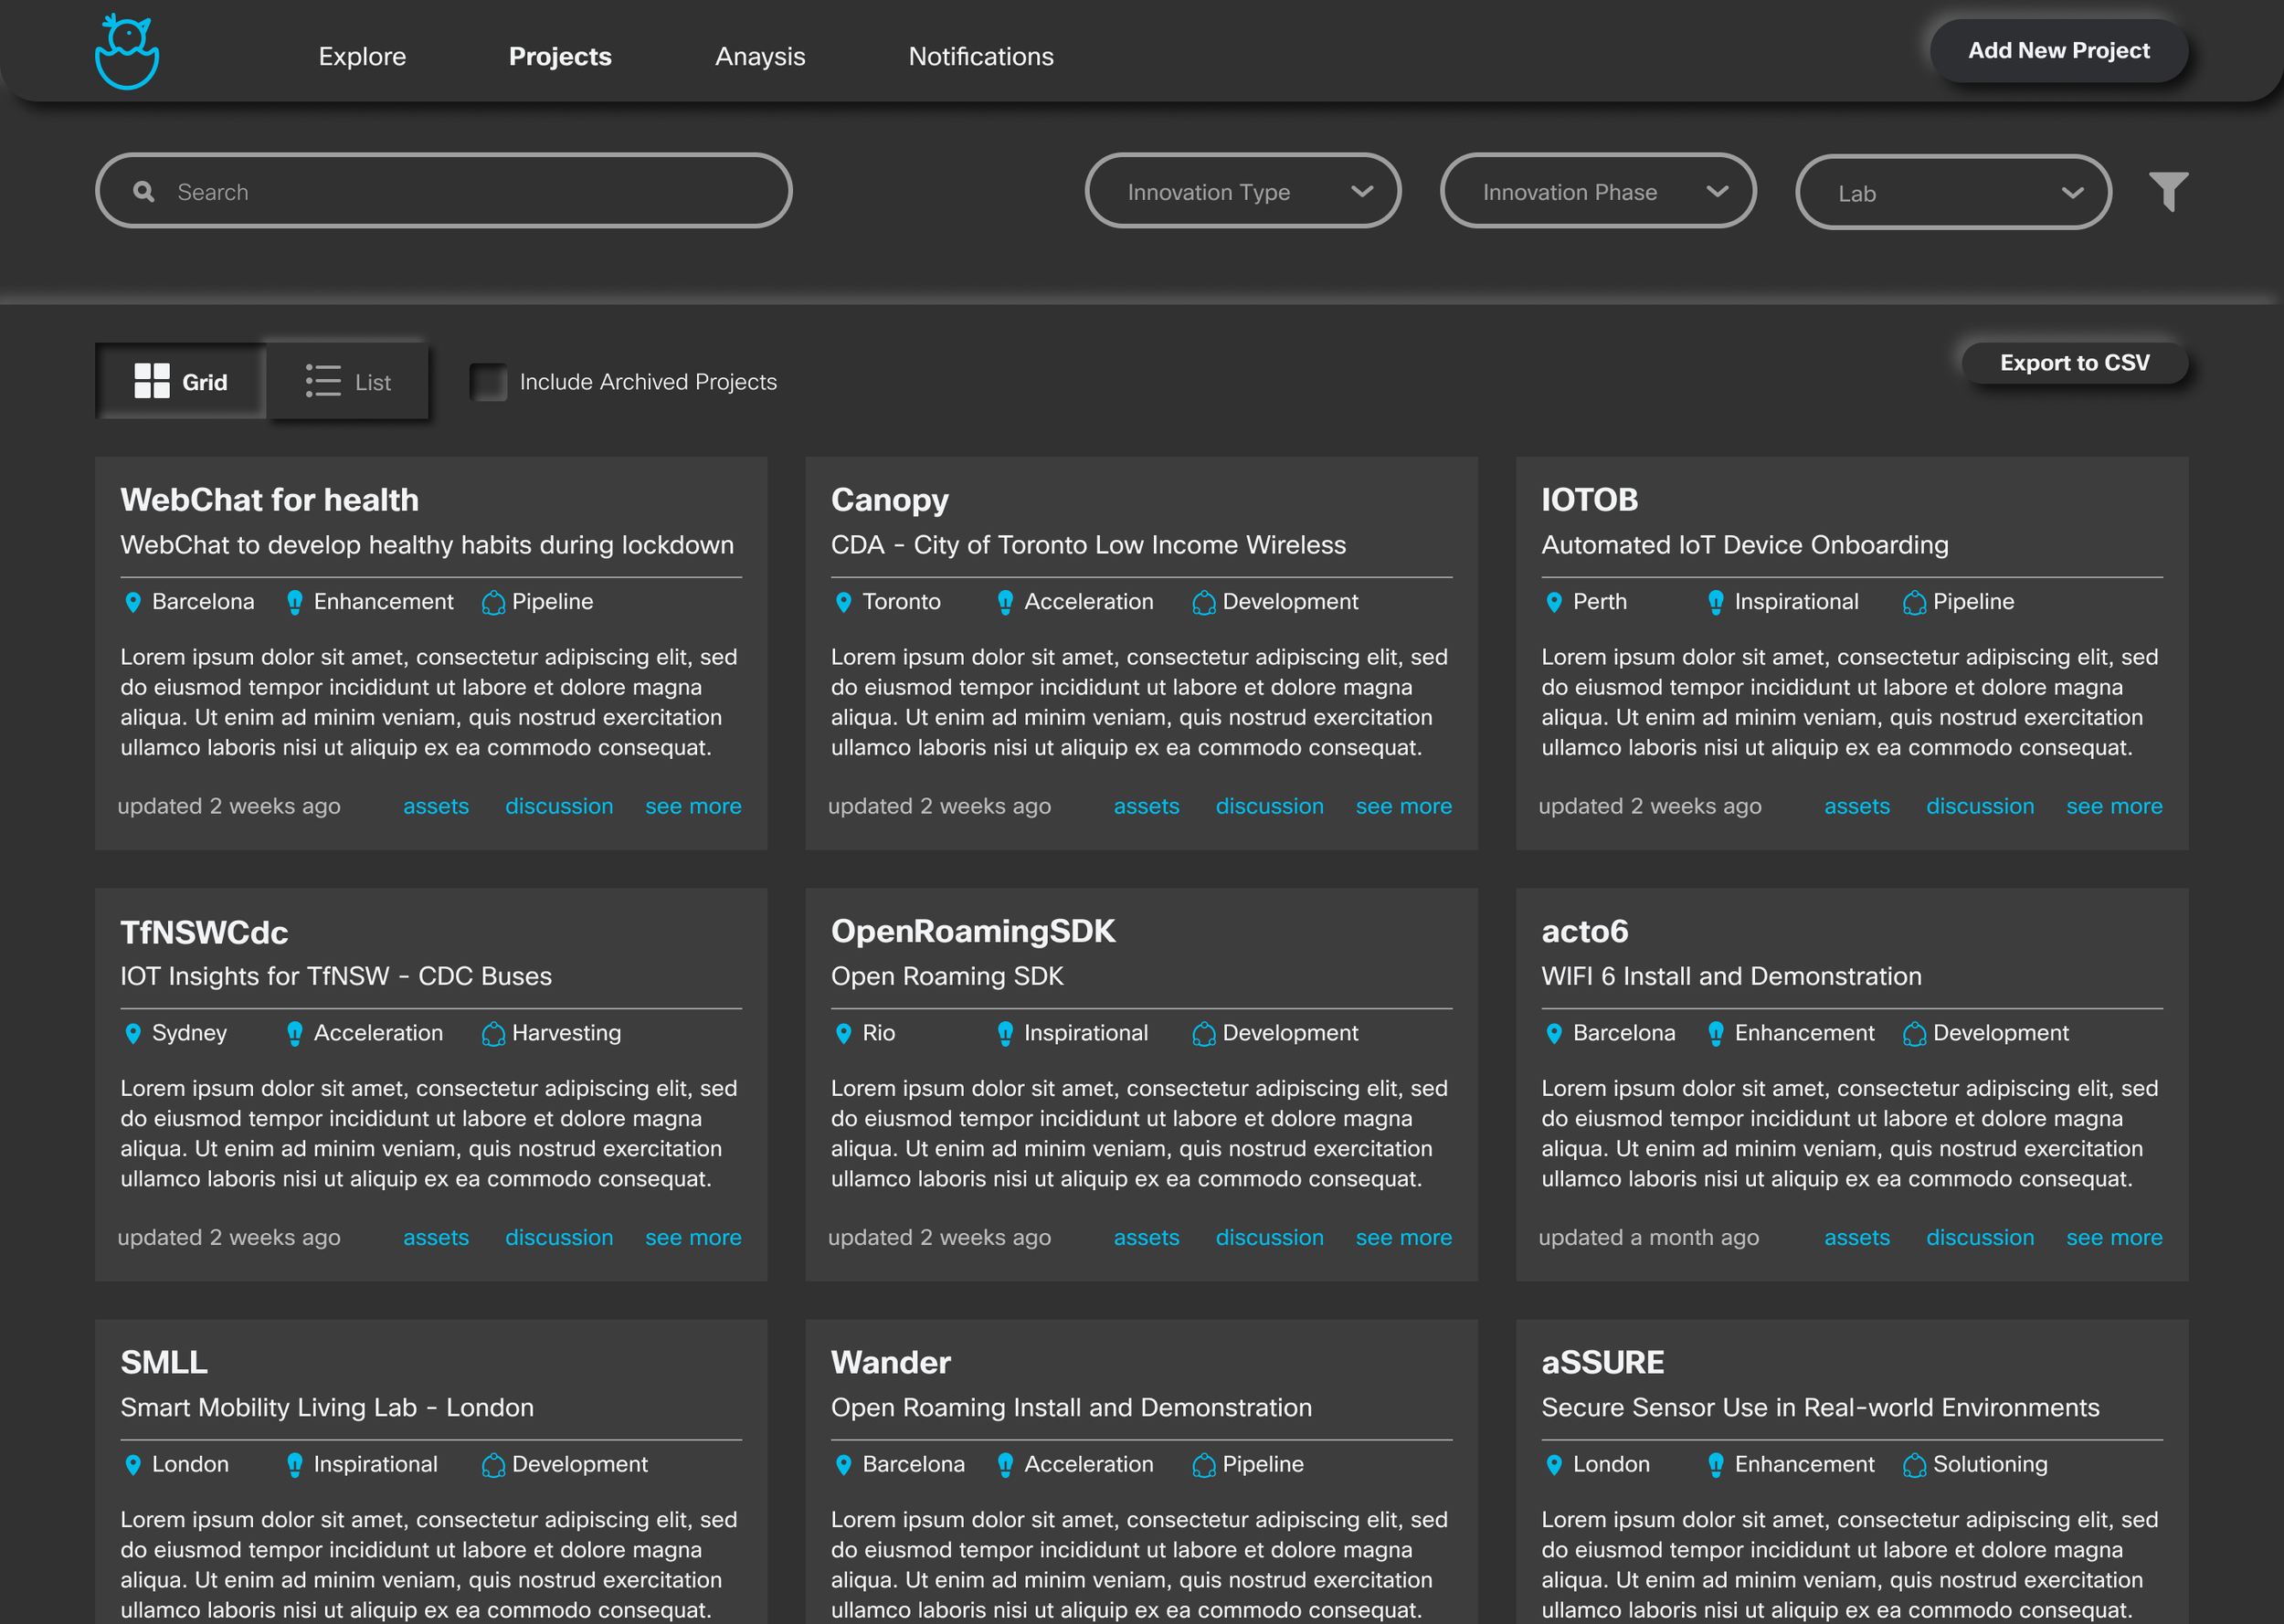
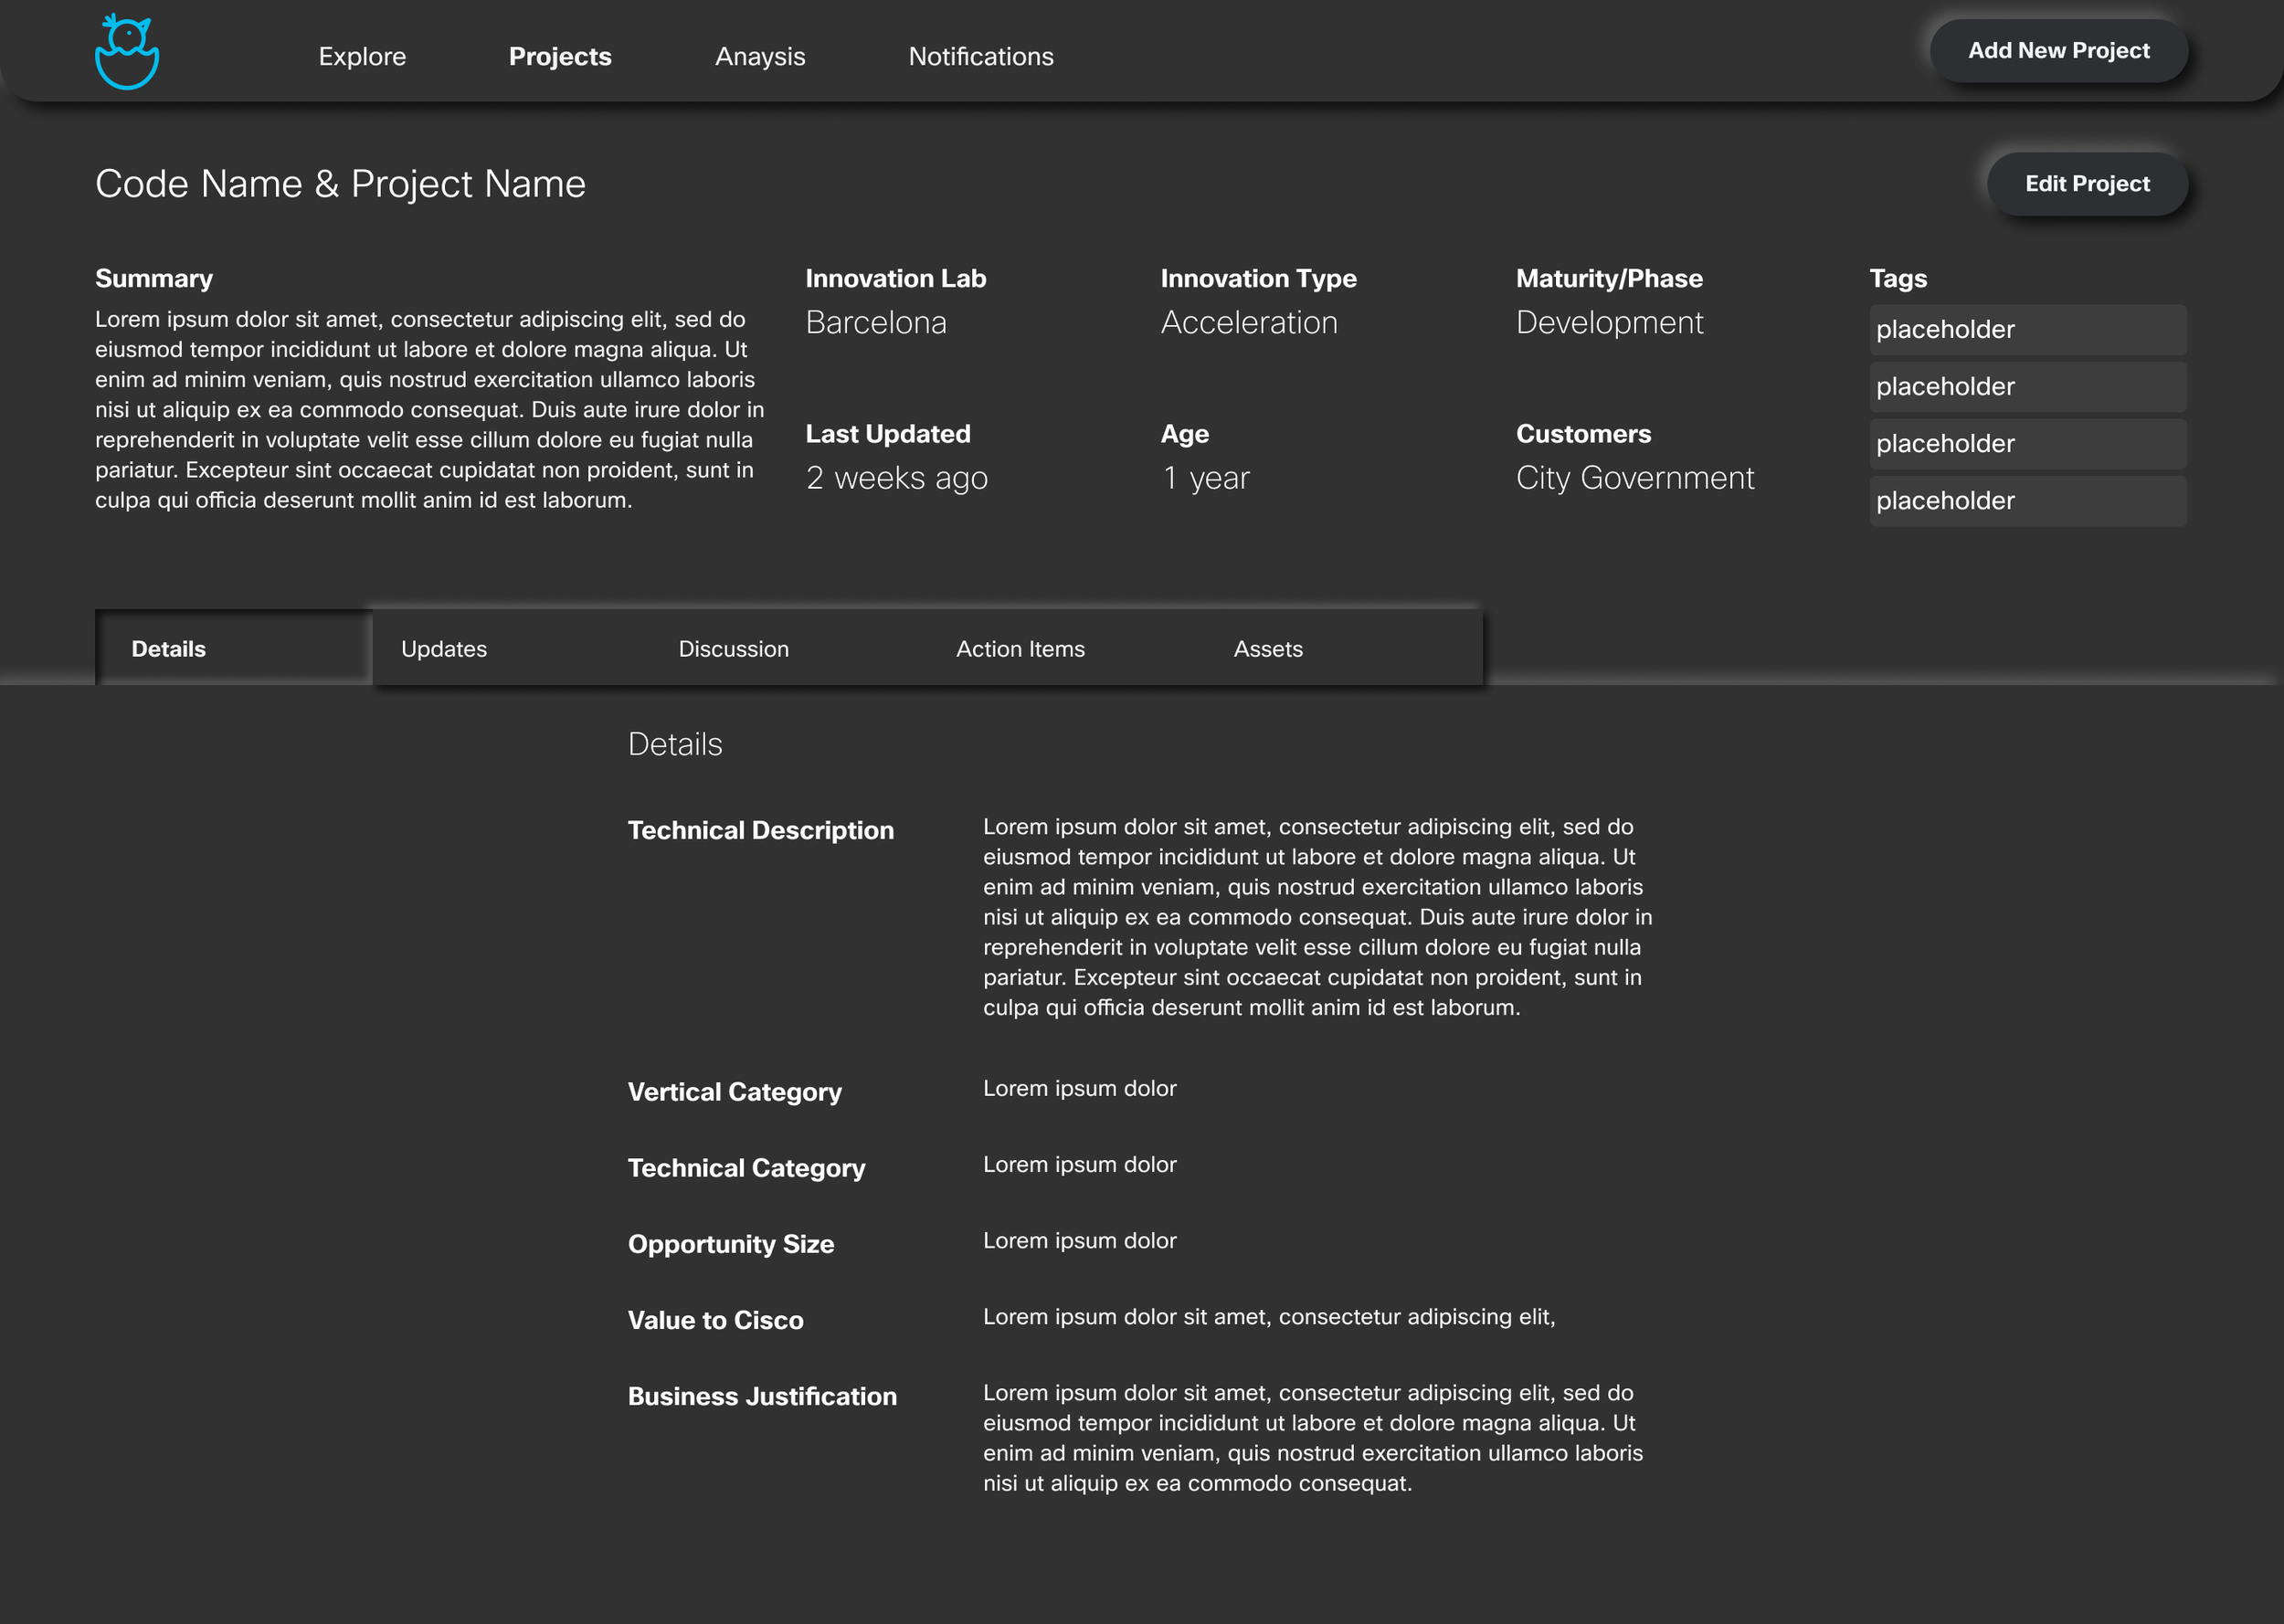
The purpose of the mockups was to explore a solution that addressed the design requirements identified by the user interviews. Because we spent time understanding what “project tracking” meant to the team, there was flexibility in the solution. As the team moved forward, there was a clear distinction between operationally tracking what projects are being worked on and having a list of projects for documentation. Therefore, there is a dual solution: create an application where the catalog of projects lives AND use an external tool to track week to week operations.


